ECONet Soil Moisture Climatology
ECONet - Soil Moisture
Drought Severity Categories
| U.S. Drought Monitor Category | Description | Percentile Range | |
|---|---|---|---|
| - | Exceptionally Wet | 98.01 to 100.00 | |
| - | Extremely Wet | 95.01 to 98.00 | |
| - | Severely Wet | 90.01 to 95.00 | |
| - | Moderately Wet | 80.01 to 90.00 | |
| - | Abnormally Wet | 70.01 to 80.00 | |
| - | Normal | 30.01 to 70.00 | |
| D0 | Abnormally Dry | 20.01 to 30.00 | |
| D1 | Moderately Dry | 10.01 to 20.00 | |
| D2 | Severely Dry | 5.01 to 10.00 | |
| D3 | Extremely Dry | 2.01 to 5.00 | |
| D4 | Exceptionally Dry | 0.00 to 2.00 |
The "dry" categories shown here are from the U.S. Drought Monitor, using their example historical percentile range for most drought indicators, while the “wet” categories are the reflection of the “dry” categories across the 50th percentile. The soil moisture values at each percentile are unique to each station and have been calculated from the station’s 20+ years of daily-averaged soil moisture observations. Additionally, the lower bounds of the Exceptionally Dry category vary by station due to the permanent wilting point, which varies by soil class and thus, by station. Information about permanent wilting points for soil classes can be found in Ratliff et al. (1983) and Hanson et al. (2000).
References Cited
About Soil Textural Groupings and Classes
Soil moisture measured by the ECONet stations is dependent on the soil class at each station. A “dry” value for sand is much different than what “dry” means for clay. To help put the measurements into perspective, information about a station's soil class and textural group can be found on this page. Soil textural class is determined by the soil’s composition of clay, sand, and silt. Using the percentage of each component in a soil sample and the soil textural triangle below, one can determine the soil class of a sample site. For example, a sample consisting of 65% sand, 10% clay, and 25% silt would be classified as sandy loam. Different textural classes can then be grouped based on the dominant component. Coarse-textured soils contain a higher percentage of sand, while fine-textured soils have a larger proportion of clay relative to the other components. Lastly, medium-textured soils are dominated by silt (Peterson et al.).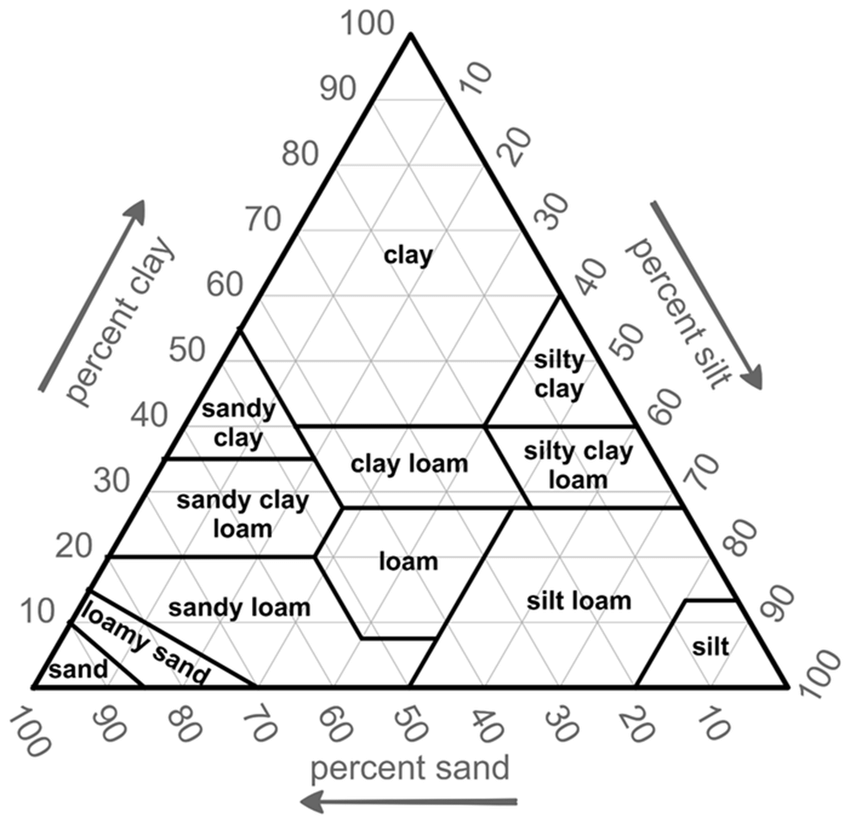

For more information, questions, or comments, please email climate-office@ncsu.edu
Note: If exporting the figure above, "Download PDF document" will result in the best resolution.